METHODS
- We used a face-to-face method. Respondents were asked to identify 3 (from most to least important) water features they valued in the watershed and three reasons they valued them. SOCIO-ECOLOGICAL CHART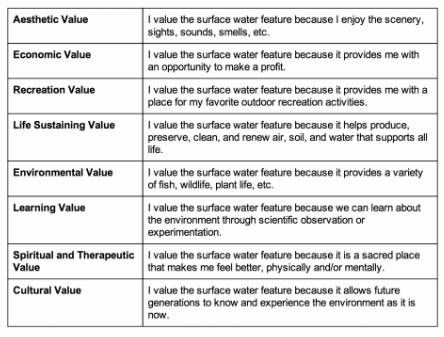
|
LABELED MAP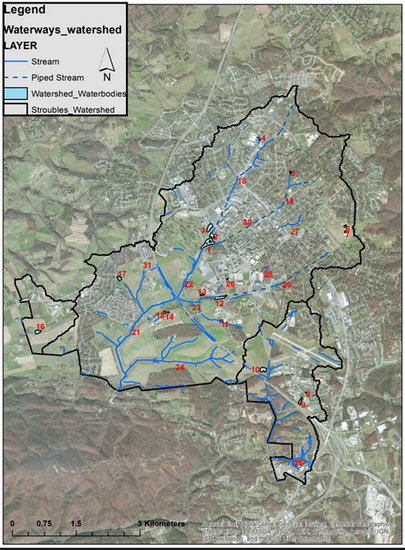
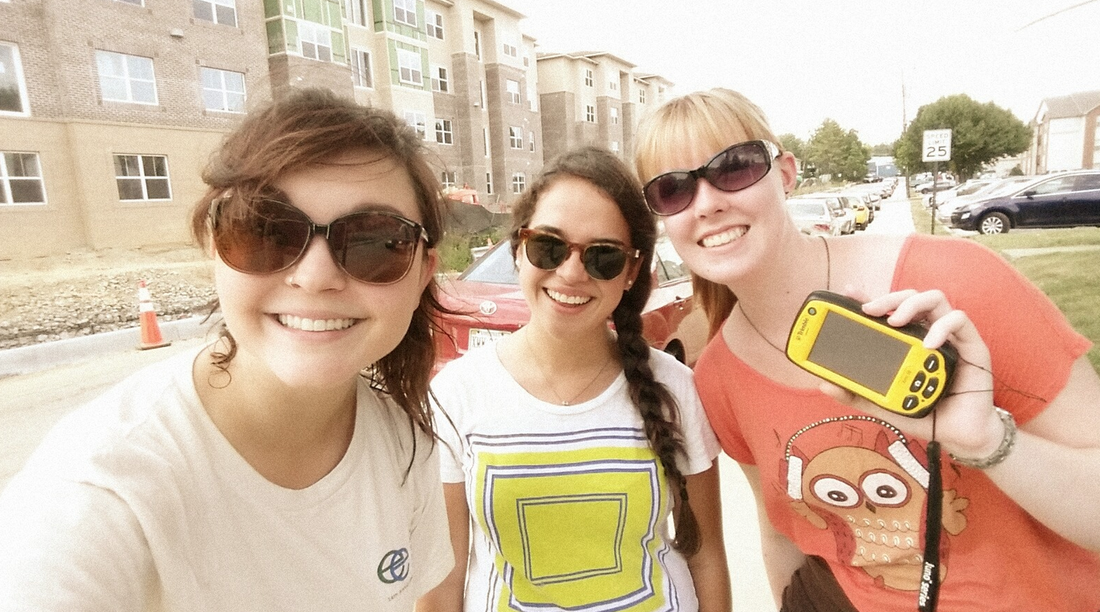
Erica, Karla, and Nicole taking surveys!
|
DEMOGRAPHICS
|
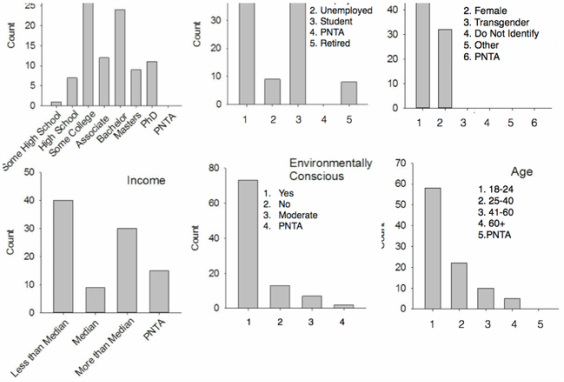
Figure 1a: The demographic profile is of an educated subgroup. Figure 1b: Our subsample largely consisted of a student population. Figure 1c: More respondents were male than female, but this does not affect the validity of our results. Figure 1d: Seeing as the population is comprised of students for the most part, income levels are typically low. Figure 1e: A majority of respondents identified themselves as being environmentally conscious. Figure 1f: Our subsample was relatively youthful, the most significant age range being 18-24. |
